
SL Paper 1
In the Canadian city of Ottawa:
The total population of Ottawa is .
Calculate the percentage of the population of Ottawa that speak English but not French.
Calculate the number of people in Ottawa that speak both English and French.
Write down your answer to part (b) in the form where and k .
Markscheme
* This question is from an exam for a previous syllabus, and may contain minor differences in marking or structure.
(M1)
Note: Award (M1) for subtracting 36 from 97.
OR

(M1)
Note: Award (M1) for 61 and 36 seen in the correct places in the Venn diagram.
(A1) (C2)
Note: Accept 61.0 (%).
[2 marks]
(M1)
Note: Award (M1) for multiplying 0.36 (or equivalent) by .
(A1) (C2)
[2 marks]
(A1)(ft)(A1)(ft) (C2)
Note: Award (A1)(ft) for 3.55 (3.546) must match part (b), and (A1)(ft) .
Award (A0)(A0) for answers of the type: . Follow through from part (b).
[2 marks]
Examiners report
The following table shows the probability distribution of a discrete random variable , in terms of an angle .
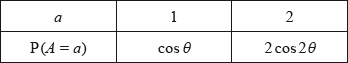
Show that .
Given that , find .
Let , for . The graph of between and is rotated 360° about the -axis. Find the volume of the solid formed.
Markscheme
* This question is from an exam for a previous syllabus, and may contain minor differences in marking or structure.
evidence of summing to 1 (M1)
eg
correct equation A1
eg
correct equation in A1
eg
evidence of valid approach to solve quadratic (M1)
egfactorizing equation set equal to
correct working, clearly leading to required answer A1
eg
correct reason for rejecting R1
eg is a probability (value must lie between 0 and 1),
Note: Award R0 for without a reason.
AG N0
valid approach (M1)
egsketch of right triangle with sides 3 and 4,
correct working
(A1)
egmissing side
A1 N2
[3 marks]
attempt to substitute either limits or the function into formula involving (M1)
eg
correct substitution of both limits and function (A1)
eg
correct integration (A1)
eg
substituting their limits into their integrated function and subtracting (M1)
eg
Note: Award M0 if they substitute into original or differentiated function.
(A1)
eg
A1 N3
[6 marks]
Examiners report
Anne-Marie planted four sunflowers in order of height, from shortest to tallest.

Flower is tall.
The median height of the flowers is .
The range of the heights is . The height of Flower is and the height of Flower is .
The mean height of the flowers is .
Find the height of Flower null.
Using this information, write down an equation in and .
Write down a second equation in and .
Using your answers to parts (b) and (c), find the height of Flower .
Using your answers to parts (b) and (c), find the height of Flower .
Markscheme
* This question is from an exam for a previous syllabus, and may contain minor differences in marking or structure. It appeared in a paper that permitted the use of a calculator, and so might not be suitable for all forms of practice.
OR OR (M1)
Note: Award (M1) for subtracting from the median, or equivalent.
(A1) (C2)
[2 marks]
(or equivalent) (A1) (C1)
[1 mark]
OR (or equvalent) (A1)(ft) (C1)
Note: Follow through from part (a).
[1 mark]
(A1)(ft) (C1)
Note: Follow through from parts (b) and (c).
[1 mark]
(A1)(ft) (C1)
Note: Follow through from parts (b) and (c).
[1 mark]
Examiners report
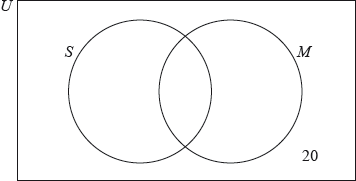
In a class of students, play tennis, play both tennis and volleyball, and do not play either sport.
The following Venn diagram shows the events “plays tennis” and “plays volleyball”. The values and represent numbers of students.

Find the value of .
Find the value of .
Find the probability that a randomly selected student from the class plays tennis or volleyball, but not both.
Markscheme
valid approach to find (M1)
eg
(may be seen on Venn diagram) A1 N2
[2 marks]
valid approach to find (M1)
eg
(may be seen on Venn diagram) A1 N2
[2 marks]
valid approach (M1)
eg , students, , 
A1 N2
[2 marks]
Examiners report
Each athlete on a running team recorded the distance ( miles) they ran in minutes.
The median distance is miles and the interquartile range is miles.
This information is shown in the following box-and-whisker plot.

The distance in miles, , can be converted to the distance in kilometres, , using the formula .
The variance of the distances run by the athletes is .
The standard deviation of the distances is miles.
A total of athletes from different teams compete in a race. The times the athletes took to run the race are shown in the following cumulative frequency graph.

There were athletes who took between and minutes to complete the race.
Find the value of .
Write down the value of the median distance in kilometres (km).
Find the value of .
Find .
The first athletes that completed the race won a prize.
Given that an athlete took between and minutes to complete the race, calculate the probability that they won a prize.
Markscheme
* This question is from an exam for a previous syllabus, and may contain minor differences in marking or structure.
valid approach (M1)
eg
A1 N2
[2 marks]
(km) A1 N1
[1 mark]
METHOD 1 (standard deviation first)
valid approach (M1)
eg
standard deviation (km) (A1)
valid approach to convert their standard deviation (M1)
eg
(miles) A1 N3
Note: If no working shown, award M1A1M0A0 for the value .
If working shown, and candidate’s final answer is , award M1A1M0A0.
METHOD 2 (variance first)
valid approach to convert variance (M1)
eg
variance (A1)
valid approach (M1)
eg
(miles) A1 N3
[4 marks]
correct frequency for minutes (A1)
eg
adding their frequency (do not accept ) (M1)
eg athletes
(minutes) A1 N3
[3 marks]
(minutes) (A1)
correct working (A1)
eg athletes between and minutes,
evidence of conditional probability or reduced sample space (M1)
eg
correct working (A1)
eg
A1 N5
Note: If no other working is shown, award A0A0M1A0A0 for answer of .
Award N0 for answer of with no other working shown.
[5 marks]
Examiners report
A biased four-sided die, , is rolled. Let be the score obtained when die is rolled. The probability distribution for is given in the following table.

A second biased four-sided die, , is rolled. Let be the score obtained when die is rolled.
The probability distribution for is given in the following table.

Find the value of .
Hence, find the value of .
State the range of possible values of .
Hence, find the range of possible values of .
Hence, find the range of possible values for .
Agnes and Barbara play a game using these dice. Agnes rolls die once and Barbara rolls die once. The probability that Agnes’ score is less than Barbara’s score is .
Find the value of .
Markscheme
recognising probabilities sum to (M1)
A1
[2 marks]
valid attempt to find (M1)
A1
[2 marks]
A1
[1 mark]
attempt to find a value of (M1)
OR OR
A1
[2 marks]
( OR ) (A1)
one correct boundary value A1
OR
OR
OR
OR
OR
A1
[3 marks]
METHOD 1
evidence of choosing at least four correct outcomes from
(M1)
OR OR (A1)
solving for either or M1
OR OR
OR
EITHER two correct values
and A1A1
OR one correct value
OR A1
substituting their value for or A1
OR
THEN
A1
METHOD 2 (solving for )
evidence of choosing at least four correct outcomes from
(M1)
OR OR (A1)
rearranging to make the subject M1
M1
A1
A1
[6 marks]
Examiners report
A school café sells three flavours of smoothies: mango (), kiwi fruit () and banana ().
85 students were surveyed about which of these three flavours they like.
35 students liked mango, 37 liked banana, and 26 liked kiwi fruit
2 liked all three flavours
20 liked both mango and banana
14 liked mango and kiwi fruit
3 liked banana and kiwi fruit
Using the given information, complete the following Venn diagram.

Find the number of surveyed students who did not like any of the three flavours.
A student is chosen at random from the surveyed students.
Find the probability that this student likes kiwi fruit smoothies given that they like mango smoothies.
Markscheme
* This question is from an exam for a previous syllabus, and may contain minor differences in marking or structure.
 (A1)(A1) (C2)
Note: Award (A1) for 18, 12 and 1 in correct place on Venn diagram, (A1) for 3, 16 and 11 in correct place on Venn diagram.
[2 marks]
85 − (3 + 16 + 11 + 18 + 12 + 1 + 2) (M1)
Note: Award (M1) for subtracting the sum of their values from 85.
22 (A1)(ft) (C2)
Note: Follow through from their Venn diagram in part (a).
If any numbers that are being subtracted are negative award (M1)(A0).
[2 marks]
(A1)(ft)(A1)(ft) (C2)
Note: Award (A1) for correct numerator; (A1) for correct denominator. Follow through from their Venn diagram.
[2 marks]
Examiners report
The fastest recorded speeds of eight animals are shown in the following table.

State whether speed is a continuous or discrete variable.
Write down the median speed for these animals.
Write down the range of the animal speeds.
For these eight animals find the mean speed.
For these eight animals write down the standard deviation.
Markscheme
* This question is from an exam for a previous syllabus, and may contain minor differences in marking or structure.
continuous (A1) (C1)
[1 mark]
75.5 (km h−1) (A1) (C1)
Note: Answer must be exact.
[1 mark]
294 (km h−1) (A1) (C1)
[1 mark]
OR (M1)
Note: Award (M1) for correct sum divided by 8.
89.9 (89.875)(km h−1) (A1) (C2)
[2 marks]
84.6 (84.5597…)(km h−1) (A1) (C1)
Note: If the response to part (d)(i) is awarded zero marks, a correct response to part (d)(ii) is awarded (C2).
[1 mark]
Examiners report
A health inspector analysed the amount of sugar in 500 different snacks prepared in various school cafeterias. The collected data are shown in the following box-and-whisker diagram.

Amount of sugar per snack in grams
State what 13 represents in the given diagram.
Write down the interquartile range for this data.
Write down the approximate number of snacks whose amount of sugar ranges from 18 to 20 grams.
The health inspector visits two school cafeterias. She inspects the same number of meals at each cafeteria. The data is shown in the following box-and-whisker diagrams.

Meals prepared in the school cafeterias are required to have less than 10 grams of sugar.
State, giving a reason, which school cafeteria has more meals that do not meet the requirement.
Markscheme
* This question is from an exam for a previous syllabus, and may contain minor differences in marking or structure.
median (A1) (C1)
[1 mark]
18 − 12 (A1)
Note: Award (M1) for correct quartiles seen.
6 (g) (A1) (C2)
[2 marks]
125 (A1) (C1)
[1 mark]
Cafeteria 2 (A1) (C1)
75 % > 50 % (do not meet the requirement) (R1) (C1)
OR
25 % < 50 % (meet the requirement) (R1) (C1)
Note: Do not award (A1)(R0). Award the (R1) for a correct comparison of percentages for both cafeterias, which may be in words. The percentage values or fractions must be seen. It is possible to award (A0)(R1).
[2 marks]
Examiners report
A biased four-sided die with faces labelled and is rolled and the result recorded. Let be the result obtained when the die is rolled. The probability distribution for is given in the following table where and are constants.

For this probability distribution, it is known that .
Nicky plays a game with this four-sided die. In this game she is allowed a maximum of five rolls. Her score is calculated by adding the results of each roll. Nicky wins the game if her score is at least ten.
After three rolls of the die, Nicky has a score of four.
David has two pairs of unbiased four-sided dice, a yellow pair and a red pair.
Both yellow dice have faces labelled and . Let represent the sum obtained by rolling the two yellow dice. The probability distribution for is shown below.

The first red die has faces labelled and . The second red die has faces labelled and , where and . The probability distribution for the sum obtained by rolling the red pair is the same as the distribution for the sum obtained by rolling the yellow pair.
Show that and .
Find .
Assuming that rolls of the die are independent, find the probability that Nicky wins the game.
Determine the value of .
Find the value of , providing evidence for your answer.
Markscheme
uses to form a linear equation in and (M1)
correct equation in terms of and from summing to A1
OR (or equivalent)
uses to form a linear equation in and (M1)
correct equation in terms of and from A1
OR (or equivalent)
Note: The marks for using and the marks for using may be awarded independently of each other.
evidence of correctly solving these equations simultaneously A1
for example, or
so and AG
[5 marks]
valid approach (M1)
OR
A1
[2 marks]
recognises at least one of the valid scores (, or ) required to win the game (M1)
Note: Award M0 if candidate also considers scores other than , or (such as ).
let represent the score on the last two rolls
a score of is obtained by rolling or
A1
a score of is obtained by rolling or
A1
a score of is obtained by rolling
A1
Note: The above 3 A1 marks are independent of each other.
A1
[5 marks]
(M1)
A1
[2 marks]
METHOD 1
EITHER
A1
OR
and A1
OR
and A1
THEN
A1
Note: Award A0A0 for obtained without working/reasoning/justification.
METHOD 2
EITHER
correctly lists a relevant part of the sample space A1
for example, or
or
OR
eliminates possibilities (exhaustion) for
convincingly shows that A1
, for example, from and so
THEN
A1
[2 marks]
Examiners report
A majority of candidates knew to set up equations using the sum of the probabilities in the distribution equal to 1 and/or the expected value equal to 2, however some candidates simply substituted the given values of and into their equations, which is considered working backwards and not doing what is required by the command term "show that". For the candidates who did set up both equations in terms of and , nearly all were successful in solving the resulting system of equations. Many candidates answered part (b) correctly using the given values from part (a). In part (c), most candidates recognized a sum of 6 (or more) was required in the final two rolls, but very few were able to find all the different outcomes to make this happen, especially for sums that can happen in more than one way, such as and . While some candidates were able to correctly answer parts (d) and (e), some did not attempt
these questions parts, and many did not justify their final answer in part (e).
A data set has n items. The sum of the items is 800 and the mean is 20.
The standard deviation of this data set is 3. Each value in the set is multiplied by 10.
Find n.
Write down the value of the new mean.
Find the value of the new variance.
Markscheme
* This question is from an exam for a previous syllabus, and may contain minor differences in marking or structure.
correct approach (A1)
eg
40 A1 N2
[2 marks]
200 A1 N1
[1 mark]
METHOD 1
recognizing variance = σ 2 (M1)
eg 32 = 9
correct working to find new variance (A1)
eg σ 2 × 10², 9 × 100
900 A1 N3
METHOD 2
new standard deviation is 30 (A1)
recognizing variance = σ 2 (M1)
eg 32 = 9, 302
900 A1 N3
[3 marks]
Examiners report
The following scatter diagram shows the scores obtained by seven students in their mathematics test, m, and their physics test, p.

The mean point, M, for these data is (40, 16).
Plot and label the point M on the scatter diagram.
Draw the line of best fit, by eye, on the scatter diagram.
Using your line of best fit, estimate the physics test score for a student with a score of 20 in their mathematics test.
Markscheme
* This question is from an exam for a previous syllabus, and may contain minor differences in marking or structure.
 (A1)(A1) (C2)
Note: Award (A1) for mean point plotted and (A1) for labelled M.
[2 marks]
straight line through their mean point crossing the p-axis at 5±2 (A1)(ft)(A1)(ft) (C2)
Note: Award (A1)(ft) for a straight line through their mean point. Award (A1)(ft) for a correct p-intercept if line is extended.
[2 marks]
point on line where m = 20 identified and an attempt to identify y-coordinate (M1)
10.5 (A1)(ft) (C2)
Note: Follow through from their line in part (b).
[2 marks]
Examiners report
The lengths of trout in a fisherman’s catch were recorded over one month, and are represented in the following histogram.

Complete the following table.

State whether length of trout is a continuous or discrete variable.
Write down the modal class.
Any trout with length 40 cm or less is returned to the lake.
Calculate the percentage of the fisherman’s catch that is returned to the lake.
Markscheme
* This question is from an exam for a previous syllabus, and may contain minor differences in marking or structure.
 (A2) (C2)
Note: Award (A2) for all correct entries, (A1) for 3 correct entries.
[2 marks]
continuous (A1) (C1)
[1 mark]
(A1) (C1)
Note: Accept equivalent notation such as or .
Award (A0) for “60-70” (incorrect notation).
[1 mark]
(M1)
Note: Award (M1) for their 4 divided by their 22.
(A1)(ft) (C2)
Note: Follow through from their part (a). Do not accept 0.181818….
[2 marks]
Examiners report
Rosewood College has 120 students. The students can join the sports club () and the music club ().
For a student chosen at random from these 120, the probability that they joined both clubs is and the probability that they joined the music club is.
There are 20 students that did not join either club.
Complete the Venn diagram for these students.
One of the students who joined the sports club is chosen at random. Find the probability that this student joined both clubs.
Determine whether the events and are independent.
Markscheme
* This question is from an exam for a previous syllabus, and may contain minor differences in marking or structure.
 (A1)(A1) (C2)
Note: Award (A1) for 30 in correct area, (A1) for 60 and 10 in the correct areas.
[2 marks]
(A1)(ft)(A1)(ft) (C2)
Note: Award (A1)(ft) for correct numerator of 30, (A1)(ft) for correct denominator of 90. Follow through from their Venn diagram.
[2 marks]
(R1)
Note: Award (R1) for multiplying their by .
therefore the events are independent (A1)(ft) (C2)
Note: Award (R1)(A1)(ft) for an answer which is consistent with their Venn diagram.
Do not award (R0)(A1)(ft).
Do not award final (A1) if is not calculated. Follow through from part (a).
[2 marks]
Examiners report
A random variable Z is normally distributed with mean 0 and standard deviation 1. It is known that P( < −1.6) = and P( > 2.4) = . This is shown in the following diagram.

A second random variable is normally distributed with mean and standard deviation .
It is known that P( < 1) = .
Find P(−1.6 < < 2.4). Write your answer in terms of and .
Given that > −1.6, find the probability that z < 2.4 . Write your answer in terms of and .
Write down the standardized value for .
It is also known that P( > 2) = .
Find .
Markscheme
* This question is from an exam for a previous syllabus, and may contain minor differences in marking or structure.
recognizing area under curve = 1 (M1)
eg , ,
A1 N2
[2 marks]
(seen anywhere) (A1)
recognizing conditional probability (M1)
eg ,
correct working (A1)
eg ,
A1 N4
Note: Do not award the final A1 if correct answer is seen followed by incorrect simplification.
[4 marks]
(may be seen in part (d)) A1 N1
Note: Depending on the candidate’s interpretation of the question, they may give as the answer to part (c). Such answers should be awarded the first (M1) in part (d), even when part (d) is left blank. If the candidate goes on to show as part of their working in part (d), the A1 in part (c) may be awarded.
[1 mark]
attempt to standardize (do not accept ) (M1)
eg (may be seen in part (c)), ,
correct equation with each -value (A1)(A1)
eg , ,
valid approach (to set up equation in one variable) M1
eg ,
correct working (A1)
eg , ,
A1 N2
[6 marks]
Examiners report
Srinivasa places the nine labelled balls shown below into a box.

Srinivasa then chooses two balls at random, one at a time, from the box. The first ball is not replaced before he chooses the second.
Find the probability that the first ball chosen is labelled .
Find the probability that the first ball chosen is labelled or labelled .
Find the probability that the second ball chosen is labelled , given that the first ball chosen was labelled .
Find the probability that both balls chosen are labelled .
Markscheme
(A1) (C1)
[1 mark]
(A1) (C1)
[1 mark]
(A1)(A1) (C2)
Note: Award (A1) for correct numerator, (A1) for correct denominator.
[2 marks]
(M1)
Note: Award (M1) for a correct compound probability calculation seen.
(A1) (C2)
[2 marks]
Examiners report
Jim heated a liquid until it boiled. He measured the temperature of the liquid as it cooled. The following table shows its temperature, degrees Celsius, minutes after it boiled.

Jim believes that the relationship between and can be modelled by a linear regression equation.
Write down the independent variable.
Write down the boiling temperature of the liquid.
Jim describes the correlation as very strong. Circle the value below which best represents the correlation coefficient.
Jim’s model is , for . Use his model to predict the decrease in temperature for any 2 minute interval.
Markscheme
A1 N1
[1 mark]
105 A1 N1
[1 mark]
A2 N2
[2 marks]
valid approach (M1)
eg
finding where
4.48 (degrees) A1 N2
Notes: Award no marks for answers that directly use the table to find the decrease in temperature for 2 minutes eg .
[2 marks]
Examiners report
Pablo drives to work. The probability that he leaves home before 07:00 is .
If he leaves home before 07:00 the probability he will be late for work is .
If he leaves home at 07:00 or later the probability he will be late for work is .
Copy and complete the following tree diagram.

Find the probability that Pablo leaves home before 07:00 and is late for work.
Find the probability that Pablo is late for work.
Given that Pablo is late for work, find the probability that he left home before 07:00.
Two days next week Pablo will drive to work. Find the probability that he will be late at least once.
Markscheme
* This question is from an exam for a previous syllabus, and may contain minor differences in marking or structure.
 A1A1A1 N3
Note: Award A1 for each bold fraction.
[3 marks]
multiplying along correct branches (A1)
eg
P(leaves before 07:00 ∩ late) = A1 N2
[2 marks]
multiplying along other “late” branch (M1)
eg
adding probabilities of two mutually exclusive late paths (A1)
eg
A1 N2
[3 marks]
recognizing conditional probability (seen anywhere) (M1)
eg
correct substitution of their values into formula (A1)
eg
A1 N2
[3 marks]
valid approach (M1)
eg 1 − P(not late twice), P(late once) + P(late twice)
correct working (A1)
eg
A1 N2
[3 marks]
Examiners report
The histogram shows the lengths of 25 metal rods, each measured correct to the nearest cm.

The upper quartile is 4 cm.
Write down the modal length of the rods.
Find the median length of the rods.
Calculate the lower quartile.
Calculate the interquartile range.
Markscheme
* This question is from an exam for a previous syllabus, and may contain minor differences in marking or structure.
3 (A1) (C1)
[1 mark]
median is 13th position (M1)
CF: 2, 6, 14, 20, 23, 25 (M1)
median = 3 (A1) (C3)
[3 marks]
2.5 (A1) (C1)
Note: Award (A1)(ft) if the sum of their parts (c)(i) and (c)(ii) is 4.
[1 mark]
1.5 (A1)(ft) (C1)
Note: Award (A1)(ft) if the sum of their parts (c)(i) and (c)(ii) is 4.
[1 mark]
Examiners report
University students were surveyed and asked how many hours, , they worked each month. The results are shown in the following table.

Use the table to find the following values.
The first five class intervals, indicated in the table, have been used to draw part of a cumulative frequency curve as shown.

.
.
On the same grid, complete the cumulative frequency curve for these data.
Use the cumulative frequency curve to find an estimate for the number of students who worked at most 35 hours per month.
Markscheme
(A1) (C1)
Note: Award (A1) for each correct value.
[1 mark]
(A1) (C1)
Note: Award (A1) for each correct value.
[1 mark]
 (A1)(A1) (C2)
Note: Award (A1)(ft) for their 3 correctly plotted points; award (A1)(ft) for completing diagram with a smooth curve through their points. The second (A1)(ft) can follow through from incorrect points, provided the gradient of the curve is never negative. Award (C2) for a completely correct smooth curve that goes through the correct points.
[2 marks]
a straight vertical line drawn at 35 (accept 35 ± 1) (M1)
26 (students) (A1) (C2)
Note: Accept values between 25 and 27 inclusive.
[2 marks]
Examiners report
In an international competition, participants can answer questions in only one of the three following languages: Portuguese, Mandarin or Hindi. 80 participants took part in the competition. The number of participants answering in Portuguese, Mandarin or Hindi is shown in the table.

A boy is chosen at random.
State the number of boys who answered questions in Portuguese.
Find the probability that the boy answered questions in Hindi.
Two girls are selected at random.
Calculate the probability that one girl answered questions in Mandarin and the other answered questions in Hindi.
Markscheme
* This question is from an exam for a previous syllabus, and may contain minor differences in marking or structure.
20 (A1) (C1)
[1 mark]
(A1)(A1) (C2)
Note: Award (A1) for correct numerator, (A1) for correct denominator.
[2 marks]
(A1)(M1)
Note: Award (A1) for first or second correct product seen, (M1) for adding their two products or for multiplying their product by two.
(A1) (C3)
[3 marks]
Examiners report
Hafizah harvested mangoes from her farm. The weights of the mangoes, , in grams, are shown in the following grouped frequency table.

Write down the modal group for these data.
Use your graphic display calculator to find an estimate of the standard deviation of the weights of mangoes from this harvest.
On the grid below, draw a histogram for the data in the table.

Markscheme
* This question is from an exam for a previous syllabus, and may contain minor differences in marking or structure. It appeared in a paper that permitted the use of a calculator, and so might not be suitable for all forms of practice.
(A1) (C1)
Note: Accept alternative notation or
Do not accept "".
[1 mark]
(A2) (C2)
Note: Award (A1)(A0) for an answer of .
[2 marks]
 (A2)(A1) (C3)
Note: Award (A2) for all correct heights of bars or (A1) for three or four correct heights of bars.
Award (A1) for rectangular bars all with correct left and right end points ( and ) and for no gaps; the bars do not have to be shaded.
Award at most (A2)(A0) if a ruler is not used for all lines.
[3 marks]
Examiners report
On a work day, the probability that Mr Van Winkel wakes up early is .
If he wakes up early, the probability that he is on time for work is .
If he wakes up late, the probability that he is on time for work is .
The probability that Mr Van Winkel arrives on time for work is .
Complete the tree diagram below.

Find the value of .
Markscheme
* This question is from an exam for a previous syllabus, and may contain minor differences in marking or structure.
 (A1)(A1) (C2)
Note: Award (A1) for each correct pair of probabilities.
[2 marks]
(A1)(ft)(M1)(M1)
Note: Award (A1)(ft) for two correct products from part (a), (M1) for adding their products, (M1) for equating the sum of any two probabilities to .
(A1)(ft) (C4)
Note: Award the final (A1)(ft) only if . Follow through from part (a).
[4 marks]
Examiners report
A survey at a swimming pool is given to one adult in each family. The age of the adult, years old, and of their eldest child, years old, are recorded.
The ages of the eldest child are summarized in the following box and whisker diagram.

The regression line of on is . The regression line of on is .
Find the largest value of that would not be considered an outlier.
One of the adults surveyed is years old. Estimate the age of their eldest child.
Find the mean age of all the adults surveyed.
Markscheme
(A1)
attempt to find (M1)
A1
[3 marks]
choosing (M1)
(years old) A1
[2 marks]
attempt to solve system by substitution or elimination (M1)
(years old) A1
[2 marks]
Examiners report
Many candidates correctly found the value of 16. Some then incorrectly went on to state that 15 was therefore the minimum value that was not an outlier. For part (b) students needed to choose the appropriate rule to use to estimate the child's age. It was clear that many did not know there was a choice to be made and used both equations. As the mean point (𝑐̅,𝑎̅ ) lies on both regression lines, in part (c) candidates needed to solve the system of equations to find the mean adult age, 𝑎̅. Few candidates seemed to be aware of this.
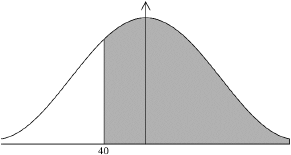
The mass of a certain type of Chilean corncob follows a normal distribution with a mean of 400 grams and a standard deviation of 50 grams.
A farmer labels one of these corncobs as premium if its mass is greater than grams. 25% of these corncobs are labelled as premium.
Write down the probability that the mass of one of these corncobs is greater than 400 grams.
Find the value of .
Estimate the interquartile range of the distribution.
Markscheme
* This question is from an exam for a previous syllabus, and may contain minor differences in marking or structure.
(A1) (C1)
[1 mark]
OR (M1)
Note: Award (M1) for a sketch of approximate normal curve with a vertical line drawn to the right of the mean with the area to the right of this line shaded.
(A1) (C2)
[2 marks]
(A1)(ft)(M1)
Note: Award (A1)(ft) for seen, award (M1) for multiplying their 33.7244… by 2. Follow through from their answer to part (b).
OR
(A1)(ft)(M1)
Note: Award (A1)(ft) for their seen, (M1) for difference between their answer to (b) and their 366.
OR
 (A1)(ft)(M1)
Note: Award (A1)(ft) for their seen. Award (M1) for correct symmetrical region indicated on labelled normal curve.
67.4 (g) (A1)(ft) (C3)
Note: Accept an answer of 68 from use of rounded values. Follow through from part (b).
[3 marks]
Examiners report
The Home Shine factory produces light bulbs, 7% of which are found to be defective.
Francesco buys two light bulbs produced by Home Shine.
The Bright Light factory also produces light bulbs. The probability that a light bulb produced by Bright Light is not defective is .
Deborah buys three light bulbs produced by Bright Light.
Write down the probability that a light bulb produced by Home Shine is not defective.
Find the probability that both light bulbs are not defective.
Find the probability that at least one of Francesco’s light bulbs is defective.
Write down an expression, in terms of , for the probability that at least one of Deborah’s three light bulbs is defective.
Markscheme
* This question is from an exam for a previous syllabus, and may contain minor differences in marking or structure.
0.93 (93%) (A1) (C1)
[1 mark]
(M1)
Note: Award (M1) for squaring their answer to part (a).
0.865 (0.8649; 86.5%) (A1)(ft) (C2)
Notes: Follow through from part (a).
Accept .
[2 marks]
(M1)
Note: Follow through from their answer to part (b)(i).
OR
(M1)
Note: Follow through from part (a).
0.135 (0.1351; 13.5%) (A1)(ft) (C2)
[2 marks]
(A1) (C1)
Note: Accept or equivalent.
[1 mark]
Examiners report
A large school has students from Year 6 to Year 12.
A group of students in Year 12 were randomly selected and surveyed to find out how many hours per week they each spend doing homework. Their results are represented by the following cumulative frequency graph.

This same information is represented by the following table.

There are students in Year 12 at this school.
Find the median number of hours per week these Year 12 students spend doing homework.
Given that of these Year 12 students spend more than hours per week doing homework, find the value of .
Find the value of and the value of .
Estimate the number of Year 12 students that spend more than hours each week doing homework.
Explain why this sampling method might not provide an accurate representation of the amount of time all of the students in the school spend doing homework.
Suggest a more appropriate sampling method.
Markscheme
evidence of median position (M1)
students
median (hours) A1
[2 marks]
recognizing there are students in the top (M1)
students spent less than hours (A1)
(hours) A1
[3 marks]
hours is students OR (M1)
A1
hours is students OR OR (A1)
A1
[4 marks]
of the students OR spend more than hours doing homework (A1)
OR OR (A1)
(students) A1
[3 marks]
only year 12 students surveyed OR amount of homework might be different for different year levels R1
[1 mark]
stratified sampling OR survey students in all years R1
[1 mark]
Examiners report
A bag contains marbles, two of which are blue. Hayley plays a game in which she randomly draws marbles out of the bag, one after another, without replacement. The game ends when Hayley draws a blue marble.
Let = 5. Find the probability that the game will end on her
Find the probability, in terms of , that the game will end on her first draw.
Find the probability, in terms of , that the game will end on her second draw.
third draw.
fourth draw.
Hayley plays the game when = 5. She pays $20 to play and can earn money back depending on the number of draws it takes to obtain a blue marble. She earns no money back if she obtains a blue marble on her first draw. Let M be the amount of money that she earns back playing the game. This information is shown in the following table.

Find the value of so that this is a fair game.
Markscheme
A1 N1
[1 mark]
correct probability for one of the draws A1
eg P(not blue first) = , blue second =
valid approach (M1)
eg recognizing loss on first in order to win on second, P(B' then B), P(B') × P(B | B'), tree diagram
correct expression in terms of A1 N3
eg , ,
[3 marks]
correct working (A1)
eg
A1 N2
[2 marks]
correct working (A1)
eg
A1 N2
[2 marks]
correct probabilities (seen anywhere) (A1)(A1)
eg , (may be seen on tree diagram)
valid approach to find E (M) or expected winnings using their probabilities (M1)
eg ,
correct working to find E (M) or expected winnings (A1)
eg ,
correct equation for fair game A1
eg ,
correct working to combine terms in (A1)
eg , ,
= 5 A1 N0
Note: Do not award the final A1 if the candidate’s FT probabilities do not sum to 1.
[7 marks]
Examiners report
Malthouse school opens at 08:00 every morning.
The daily arrival times of the 500 students at Malthouse school follow a normal distribution. The mean arrival time is 52 minutes after the school opens and the standard deviation is 5 minutes.
Find the probability that a student, chosen at random arrives at least 60 minutes after the school opens.
Find the probability that a student, chosen at random arrives between 45 minutes and 55 minutes after the school opens.
A second school, Mulberry Park, also opens at 08:00 every morning. The arrival times of the students at this school follows exactly the same distribution as Malthouse school.
Given that, on one morning, 15 students arrive at least 60 minutes after the school opens, estimate the number of students at Mulberry Park school.
Markscheme
0.0548 (0.054799…, 5.48%) (A2) (C2)

[2 marks]
0.645 (0.6449900…, 64.5%) (A2) (C2)

[2 marks]
(M1)
Note: Award (M1) for dividing 15 by their part (a)(i).
Accept an equation of the form 15 = x × 0.0548 for (M1).
274 (273.722…) (A1)(ft) (C2)
Note: Follow through from part (a)(i). Accept 273.
[2 marks]
Examiners report
Colorado beetles are a pest, which can cause major damage to potato crops. For a certain Colorado beetle the amount of oxygen, in millilitres (ml), consumed each day increases with temperature as shown in the following table.

This information has been used to plot a scatter diagram.

The mean point has coordinates (20, 230).
Find the equation of the regression line of on .
Draw the regression line of on on the scatter diagram.
In order to estimate the amount of oxygen consumed, this regression line is considered to be reliable for a temperature such that ≤ ≤ .
Write down the value of and of .
Markscheme
* This question is from an exam for a previous syllabus, and may contain minor differences in marking or structure.
(A1)(A1) (C2)
Note: Award (A1) for ; (A1) for −80. Award at most (A1)(A0) if answer is not an equation. Award (A0)(A1)(ft) for .
[2 marks]
 (A1)(A1) (C2)
Note: Award (A1) for a straight line using a ruler passing through (20, 230); (A1) for correct -intercept. If a ruler has not been used, award at most (A0)(A1).
[2 marks]
AND (A1)(A1) (C2)
Note: Accept [10, 30] or 10 ≤ ≤ 30.
[2 marks]
Examiners report
Dune Canyon High School organizes its school year into three trimesters: fall/autumn (), winter () and spring (). The school offers a variety of sporting activities during and outside the school year.
The activities offered by the school are summarized in the following Venn diagram.

Write down the number of sporting activities offered by the school during its school year.
Determine whether rock-climbing is offered by the school in the fall/autumn trimester.
Write down the elements of the set ;
Write down .
Write down, in terms of , and , an expression for the set which contains only archery, baseball, kayaking and surfing.
Markscheme
* This question is from an exam for a previous syllabus, and may contain minor differences in marking or structure.
15 (A1) (C1)
[1 mark]
no (A1) (C1)
Note: Accept “it is only offered in Winter and Spring”.
[1 mark]
volleyball, golf, cycling (A1) (C1)
Note: Responses must list all three sports for the (A1) to be awarded.
[1 mark]
4 (A1) (C1)
[1 mark]
OR (or equivalent) (A2) (C2)
[2 marks]
Examiners report
The following table shows the probability distribution of a discrete random variable .

Find the value of .
Find .
Markscheme
* This question is from an exam for a previous syllabus, and may contain minor differences in marking or structure.
evidence of using (M1)
correct working (A1)
eg ,
A1 N2
[3 marks]
valid approach to find (M1)
eg ,
correct working (A1)
eg
A1 N2
[3 marks]
Examiners report
Consider the following graphs of normal distributions.

At an airport, the weights of suitcases (in kg) were measured. The weights are normally distributed with a mean of 20 kg and standard deviation of 3.5 kg.
In the following table, write down the letter of the corresponding graph next to the given mean and standard deviation.

Find the probability that a suitcase weighs less than 15 kg.
Any suitcase that weighs more than kg is identified as excess baggage.
19.6 % of the suitcases at this airport are identified as excess baggage.
Find the value of .
Markscheme
* This question is from an exam for a previous syllabus, and may contain minor differences in marking or structure.
 (A1)(A1) (C2)
Note: Award (A1) for each correct entry.
[2 marks]
 (M1)
(M1)
Note: Award (M1) for sketch with 15 labelled and left tail shaded OR for a correct probability statement, P(X < 15).
0.0766 (0.0765637…, 7.66%) (A1) (C2)
[2 marks]
 (M1)
(M1)
Note: Award (M1) for a sketch showing correctly shaded region to the right of the mean with 19.6% labelled (accept shading of the complement with 80.4% labelled) OR for a correct probability statement, P(X > ) = 0.196 or P(X ≤ ) = 0.804.
23.0 (kg) (22.9959… (kg)) (A1) (C2)
[2 marks]
Examiners report
The following box-and-whisker plot shows the number of text messages sent by students in a school on a particular day.

Find the value of the interquartile range.
One student sent k text messages, where k > 11 . Given that k is an outlier, find the least value of k.
Markscheme
* This question is from an exam for a previous syllabus, and may contain minor differences in marking or structure.
recognizing Q1 or Q3 (seen anywhere) (M1)
eg 4,11 , indicated on diagram
IQR = 7 A1 N2
[2 marks]
recognizing the need to find 1.5 IQR (M1)
eg 1.5 × IQR, 1.5 × 7
valid approach to find k (M1)
eg 10.5 + 11, 1.5 × IQR + Q3
21.5 (A1)
k = 22 A1 N3
Note: If no working shown, award N2 for an answer of 21.5.
[4 marks]
Examiners report
The following Venn diagram shows the events and , where . The values shown are probabilities.

Find the value of .
Find the value of .
Find .
Markscheme
* This question is from an exam for a previous syllabus, and may contain minor differences in marking or structure.
valid approach (M1)
eg 0.30 − 0.1, + 0.1 = 0.3
= 0.2 A1 N2
[2 marks]
valid approach (M1)
eg 1 − (0.3 + 0.4), 1 − 0.4 − 0.1 −
= 0.3 A1 N2
[2 marks]
valid approach (M1)
eg , , ,

A1 N2
[2 marks]
Examiners report
A survey was carried out to investigate the relationship between a person’s age in years ( ) and the number of hours they watch television per week (). The scatter diagram represents the results of the survey.

The mean age of the people surveyed was 50.
For these results, the equation of the regression line on is .
Find the mean number of hours that the people surveyed watch television per week.
Draw the regression line on the scatter diagram.
By placing a tick (✔) in the correct box, determine which of the following statements is true:

Diogo is 18 years old. Give a reason why the regression line should not be used to estimate the number of hours Diogo watches television per week.
Markscheme
* This question is from an exam for a previous syllabus, and may contain minor differences in marking or structure.
(M1)
Note: Award (M1) for correct substitution of 50 into equation of the regression line.
(A1) (C2)
OR
(M1)
Note: Award (M1) for correctly summing the values of the points, and dividing by 25.
(A1) (C2)
[2 marks]
line through and (A1)(ft)(A1) (C2)
Note: Award (A1)(ft) for a straight line through (50, their ), and (A1) for the line intercepting the -axis at ; this may need to be extrapolated. Follow through from part (a). Award at most (A0)(A1) if the line is not drawn with a ruler.
[2 marks]
 (A1) (C1)
Note: Award (A0) if more than one tick (✔) is seen.
[1 mark]
18 is less than the lowest age in the survey OR extrapolation. (A1) (C1)
Note: Accept equivalent statements.
[1 mark]
Examiners report
The price per kilogram of tomatoes, in euro, sold in various markets in a city is found to be normally distributed with a mean of 3.22 and a standard deviation of 0.84.
Find the price that is two standard deviations above the mean price.
Find the probability that the price of a kilogram of tomatoes, chosen at random, will be between 2.00 and 3.00 euro.
To stimulate reasonable pricing, the city offers a free permit to the sellers whose price of a kilogram of tomatoes is in the lowest 20 %.
Find the highest price that a seller can charge and still receive a free permit.
Markscheme
4.90 (A1) (C1)
[1 mark]
0.323 (0.323499…; 32.3 %) (A2) (C2)
Note: If final answer is incorrect, (M1)(A0) may be awarded for correct shaded area shown on a sketch, below, or for a correct probability statement “P(2 ≤ ≤ 3)” (accept other variables for or “price” and strict inequalities).

[2 marks]
2.51 (2.51303…) (A2) (C2)
Note: If final answer is incorrect, (M1)(A0) may be awarded for correct shaded area shown on a sketch, below, or for a correct probability statement “P( ≤ ) = 0.2” (accept other variables and strict inequalities).

[2 marks]
Examiners report
A research student weighed lizard eggs in grams and recorded the results. The following box and whisker diagram shows a summary of the results where and are the lower and upper quartiles respectively.

The interquartile range is grams and there are no outliers in the results.
Find the minimum possible value of .
Hence, find the minimum possible value of .
Markscheme
attempt to use definition of outlier
(M1)
(, accept ) OR A1
minimum value of A1
[3 marks]
attempt to use interquartile range (M1)
(may be seen in part (a)) OR (accept )
minimum value of A1
[2 marks]
Examiners report
Consider the following Venn diagrams.

Write down an expression, in set notation, for the shaded region represented by Diagram 1.
Write down an expression, in set notation, for the shaded region represented by Diagram 2.
Write down an expression, in set notation, for the shaded region represented by Diagram 3.
Shade, on the Venn diagram, the region represented by the set .

Shade, on the Venn diagram, the region represented by the set .

Markscheme
A' (A1)
Note: Accept alternative set notation for complement such as U − A.
[1 mark]
OR (A1)
Note: Accept alternative set notation for complement.
[1 mark]
OR (A2) (C4)
Note: Accept equivalent answers, for example .
[2 marks]
 (A1)
(A1)
[1 mark]
 (A1) (C2)
[1 mark]
Examiners report
A bag contains 5 red and 3 blue discs, all identical except for the colour. First, Priyanka takes a disc at random from the bag and then Jorgé takes a disc at random from the bag.
Complete the tree diagram.

Find the probability that Jorgé chooses a red disc.
Markscheme
* This question is from an exam for a previous syllabus, and may contain minor differences in marking or structure.
 (A1)(A1)(A1) (C3)
Note: Award (A1) for each correct pair of branches.
[3 marks]
(A1)(ft)(M1)
Note: Award (A1)(ft) for their two correct products from their tree diagram. Follow through from part (a), award (M1) for adding their two products. Award (M0) if additional products or terms are added.
= (A1)(ft) (C3)
Note: Follow through from their tree diagram, only if probabilities are [0,1].
[3 marks]
Examiners report
The following table shows the probability distribution of a discrete random variable where .

Find the value of , justifying your answer.
Markscheme
* This sample question was produced by experienced DP mathematics senior examiners to aid teachers in preparing for external assessment in the new MAA course. There may be minor differences in formatting compared to formal exam papers.
uses (M1)
A1
EITHER
attempts to factorize their quadratic M1
OR
attempts use of the quadratic formula on their equation M1
THEN
A1
rejects as this value leads to invalid probabilities, for example, R1
so A1
Note: Award R0A1 if is stated without a valid reason given for rejecting .
[6 marks]
Examiners report
Events and are independent with and .
Find .
Find .
Markscheme
* This question is from an exam for a previous syllabus, and may contain minor differences in marking or structure.
valid interpretation (may be seen on a Venn diagram) (M1)
eg
A1 N2
[2 marks]
valid attempt to find (M1)
eg
correct working for (A1)
eg
correct working for (A1)
eg
A1 N3
[4 marks]
Examiners report
A scientist measures the concentration of dissolved oxygen, in milligrams per litre (y) , in a river. She takes 10 readings at different temperatures, measured in degrees Celsius (x).
The results are shown in the table.

It is believed that the concentration of dissolved oxygen in the river varies linearly with the temperature.
For these data, find Pearson’s product-moment correlation coefficient, r.
For these data, find the equation of the regression line y on x.
Using the equation of the regression line, estimate the concentration of dissolved oxygen in the river when the temperature is 18 °C.
Markscheme
−0.974 (−0.973745…) (A2)
Note: Award (A1) for an answer of 0.974 (minus sign omitted). Award (A1) for an answer of −0.973 (incorrect rounding).
[2 marks]
y = −0.365x + 17.9 (y = −0.365032…x + 17.9418…) (A1)(A1) (C4)
Note: Award (A1) for −0.365x, (A1) for 17.9. Award at most (A1)(A0) if not an equation or if the values are reversed (eg y = 17.9x −0.365).
[2 marks]
y = −0.365032… × 18 + 17.9418… (M1)
Note: Award (M1) for correctly substituting 18 into their part (a)(ii).
= 11.4 (11.3712…) (A1)(ft) (C2)
Note: Follow through from part (a)(ii).
[2 marks]
Examiners report
The random variable is normally distributed with a mean of 100. The following diagram shows the normal curve for .

Let be the shaded region under the curve, to the right of 107. The area of is 0.24.
Write down .
Find .
Find .
Markscheme
* This question is from an exam for a previous syllabus, and may contain minor differences in marking or structure.
A1 N1
[1 mark]
valid approach (M1)
eg
correct working (A1)
eg
A1 N2
[3 marks]
valid approach (M1)
eg
A1 N2
[2 marks]
Examiners report
In a class of students, are fluent in Spanish, are fluent in French, and are not fluent in either of these languages. The following Venn diagram shows the events “fluent in Spanish” and “fluent in French”.
The values , , and represent numbers of students.

Write down the value of .
Find the value of .
Write down the value of and of .
Markscheme
A1 N1
[1 mark]
valid approach (M1)
eg , ,
A1 N2
[2 marks]
valid approach for finding or (may be seen in part (b)) (M1)
eg ,
, A1A1 N3
[3 marks]
Examiners report
A group of 20 students travelled to a gymnastics tournament together. Their ages, in years, are given in the following table.

The lower quartile of the ages is 16 and the upper quartile is 18.5.
For the students in this group find the mean age;
For the students in this group write down the median age.
Draw a box-and-whisker diagram, for these students’ ages, on the following grid.

Markscheme
(M1)
Note: Award (M1) for correct substitutions into mean formula.
(A1) (C2)
[2 marks]
16.5 (A1) (C1)
[1 mark]
 (A1)(A1)(A1)(ft) (C3)
Note: Award (A1) for correct endpoints, (A1) for correct quartiles, (A1)(ft) for their median. Follow through from part (a)(ii), but only if median is between 16 and 18.5. If a horizontal line goes through the box, award at most (A1)(A1)(A0). Award at most (A0)(A1)(A1) if a ruler has not been used.
[3 marks]
Examiners report
In a high school, 160 students completed a questionnaire which asked for the number of people they are following on a social media website. The results were recorded in the following box-and-whisker diagram.

The following incomplete table shows the distribution of the responses from these 160 students.

Write down the median.
Complete the table.
Write down the mid-interval value for the 100 < x ≤ 150 group.
Using the table, calculate an estimate for the mean number of people being followed on the social media website by these 160 students.
Markscheme
* This question is from an exam for a previous syllabus, and may contain minor differences in marking or structure.
180 (A1) (C1)
[1 mark]
36, 24 (A1)(A1) (C2)
Note: Award (A0)(A1) for two incorrect values that add up to 60.
[2 marks]
125 (accept 125.5) (A1)
(M1)
Note: Award (M1) for correct substitution of their mid-interval values, multiplied by their frequencies, into mean formula.
=156 (155.625) (A1)(ft) (C3)
Note: Follow through from parts (b) and (c)(i).
[3 marks]
Examiners report
The histogram shows the time, t, in minutes, that it takes the customers of a restaurant to eat their lunch on one particular day. Each customer took less than 25 minutes.
The histogram is incomplete, and only shows data for 0 ≤ t < 20.

The mean time it took all customers to eat their lunch was estimated to be 12 minutes.
It was found that k customers took between 20 and 25 minutes to eat their lunch.
Write down the mid-interval value for 10 ≤ t < 15.
Write down the total number of customers in terms of k.
Calculate the value of k.
Hence, complete the histogram.
Markscheme
* This question is from an exam for a previous syllabus, and may contain minor differences in marking or structure.
12.5 (A1) (C1)
[1 mark]
33 + k OR 10 + 8 + 5 + 10 + k (A1)
Note: Award (A1) for “number of customers = 33 + k”.
[1 mark]
(M1)(A1)(ft)
Note: Award (M1) for substitution into the mean formula and equating to 12, (A1)(ft) for their correct substitutions.
(k =) 7 (A1)(ft) (C4)
Note: Follow through from part (b)(i) and their mid-interval values, consistent with part (a). Do not award final (A1) if answer is not an integer.
[3 marks]
 (A1)(ft) (C1)
Note: Follow through from their part (b)(ii) but only if the value is between 1 and 10, inclusive.
[1 mark]
Examiners report
A group of 10 girls recorded the number of hours they spent watching television during a particular week. Their results are summarized in the box-and-whisker plot below.

The group of girls watched a total of 180 hours of television.
A group of 20 boys also recorded the number of hours they spent watching television that same week. Their results are summarized in the table below.

The following week, the group of boys had exams. During this exam week, the boys spent half as much time watching television compared to the previous week.
For this exam week, find
The range of the data is 16. Find the value of .
Find the value of the interquartile range.
Find the mean number of hours that the girls in this group spent watching television that week.
Find the total number of hours the group of boys spent watching television that week.
Find the mean number of hours that all 30 girls and boys spent watching television that week.
the mean number of hours that the group of boys spent watching television.
Markscheme
* This question is from an exam for a previous syllabus, and may contain minor differences in marking or structure.
valid approach (M1)
eg 16 + 8, − 8
24 (hours) A1 N2
[2 marks]
valid approach (M1)
eg 20 − 15, , 15 − 20
IQR = 5 A1 N2
[2 marks]
correct working (A1)
eg , ,
mean = 18 (hours) A1 N2
[2 marks]
attempt to find total hours for group B (M1)
eg
group B total hours = 420 (seen anywhere) A1 N2
[2 marks]
attempt to find sum for combined group (may be seen in working) (M1)
eg 180 + 420, 600
correct working (A1)
eg ,
mean = 20 (hours) A1 N2
[3 marks]
valid approach to find the new mean (M1)
eg ,
mean (= 10.5) hours A1 N2
[2 marks]
Examiners report
In a group of 20 girls, 13 take history and 8 take economics. Three girls take both history and economics, as shown in the following Venn diagram. The values and represent numbers of girls.

Find the value of ;
Find the value of .
A girl is selected at random. Find the probability that she takes economics but not history.
Markscheme
valid approach (M1)
eg
A1 N2
[2 marks]
valid approach (M1)
eg
A1 N2
[2 marks]
valid approach (M1)
eg
A1 N2
[2 marks]
Examiners report
A set of data comprises of five numbers which have been placed in ascending order.
Recalling definitions, such as the Lower Quartile is the piece of data with the data placed in order, find an expression for the Interquartile Range.
Hence, show that a data set with only 5 numbers in it cannot have any outliers.
Give an example of a set of data with 7 numbers in it that does have an outlier, justify this fact by stating the Interquartile Range.
Markscheme
M1A1
[2 marks]
M1A1
Since due to the ascending order. R1
Similarly M1A1
Since due to the ascending order.
So there are no outliers for a data set of 5 numbers. AG
[5 marks]
For example 1, 2, 3, 4, 5, 6, 100 where A1A1
[2 marks]
Examiners report
For a study, a researcher collected 200 leaves from oak trees. After measuring the lengths of the leaves, in cm, she produced the following cumulative frequency graph.

The researcher finds that 10% of the leaves have a length greater than cm.
Write down the median length of these leaves.
Write down the number of leaves with a length less than or equal to 8 cm.
Use the graph to find the value of .
Before measuring, the researcher estimated to be approximately 9.5 cm. Find the percentage error in her estimate.
Markscheme
* This question is from an exam for a previous syllabus, and may contain minor differences in marking or structure.
9 (cm) (A1) (C1)
[1 mark]
40 (leaves) (A1) (C1)
[1 mark]
or equivalent (M1)
Note: Award (M1) for a horizontal line drawn through the cumulative frequency value of 180 and meeting the curve (or the corresponding vertical line from 10.5 cm).
(A1) (C2)
Note: Accept an error of ±0.1.
[2 marks]
(M1)
Notes: Award (M1) for their correct substitution into the percentage error formula.
(A1)(ft) (C2)
Notes: Follow through from their answer to part (c)(i).
Award (A1)(A0) for an answer of with or without working.
[2 marks]
Examiners report
Applicants for a job had to complete a mathematics test. The time they took to complete the test is normally distributed with a mean of 53 minutes and a standard deviation of 16.3. One of the applicants is chosen at random.
For 11% of the applicants it took longer than minutes to complete the test.
There were 400 applicants for the job.
Find the probability that this applicant took at least 40 minutes to complete the test.
Find the value of .
Estimate the number of applicants who completed the test in less than 25 minutes.
Markscheme
* This question is from an exam for a previous syllabus, and may contain minor differences in marking or structure.
0.787 (0.787433…, 78.7%) (M1)(A1) (C2)
Note: Award (M1) for a correct probability statement, , or a correctly shaded normal distribution graph.
[2 marks]
73.0 (minutes) (72.9924…) (M1)(A1) (C2)
Note: Award (M1) for a correct probability statement, , or a correctly shaded normal distribution graph.

[2 marks]
(M1)
Note: Award (M1) for multiplying a probability by 400. Do not award (M1) for .
Use of a lower bound less than zero gives a probability of 0.0429172….
(A1) (C2)
Notes: Accept a final answer of 17. Do not accept a final answer of 18. Accept a non-integer final answer either 16.9 (16.9373…) from use of lower bound zero or 17.2 (17.1669…) from use of the default lower bound of .
[2 marks]
Examiners report
A large company surveyed 160 of its employees to find out how much time they spend traveling to work on a given day. The results of the survey are shown in the following cumulative frequency diagram.

Only 10% of the employees spent more than minutes traveling to work.
The results of the survey can also be displayed on the following box-and-whisker diagram.

Find the median number of minutes spent traveling to work.
Find the number of employees whose travelling time is within 15 minutes of the median.
Find the value of .
Write down the value of .
Find the value of .
Hence, find the interquartile range.
Travelling times of less than minutes are considered outliers.
Find the value of .
Markscheme
evidence of median position (M1)
80th employee
40 minutes A1
[2 marks]
valid attempt to find interval (25–55) (M1)
18 (employees), 142 (employees) A1
124 A1
[3 marks]
recognising that there are 16 employees in the top 10% (M1)
144 employees travelled more than minutes (A1)
= 56 A1
[3 marks]
= 70 A1
[1 mark]
recognizing is first quartile value (M1)
40 employees
= 33 A1
[2 marks]
47 − 33 (M1)
IQR = 14 A1
[2 marks]
attempt to find 1.5 × their IQR (M1)
33 − 21
12 (A1)
[2 marks]
Examiners report
All the children in a summer camp play at least one sport, from a choice of football () or basketball (). 15 children play both sports.
The number of children who play only football is double the number of children who play only basketball.
Let be the number of children who play only football.
There are 120 children in the summer camp.
Write down an expression, in terms of , for the number of children who play only basketball.
Complete the Venn diagram using the above information.

Find the number of children who play only football.
Write down the value of .
Markscheme
* This question is from an exam for a previous syllabus, and may contain minor differences in marking or structure.
(A1) (C1)
[1 mark]
 (A1)(A1)(ft) (C2)
Notes: Award (A1) for 15 placed in the correct position, award (A1)(ft) for and their placed in the correct positions of diagram. Do not penalize the absence of 0 inside the rectangle and award at most (A1)(A0) if any value other than 0 is seen outside the circles. Award at most (A1)(A0) if 35 and 70 are seen instead of and their .
[2 marks]
or equivalent (M1)
Note: Award (M1) for adding the values in their Venn and equating to 120 (or equivalent).
(A1)(ft) (C2)
Note: Follow through from their Venn diagram, but only if the answer is a positive integer and is seen in their Venn diagram.
[2 marks]
85 (A1)(ft) (C1)
Note: Follow through from their Venn diagram and their answer to part (c), but only if the answer is a positive integer and less than 120.
[1 mark]
Examiners report
Box 1 contains 5 red balls and 2 white balls.
Box 2 contains 4 red balls and 3 white balls.
A box is chosen at random and a ball is drawn. Find the probability that the ball is red.
Let be the event that “box 1 is chosen” and let be the event that “a red ball is drawn”.
Determine whether events and are independent.
Markscheme
valid approach to find (M1)
tree diagram (must include probabilty of picking box) with correct required probabilities
OR OR
(A1)
A1
[3 marks]
events and are not independent, since OR OR
OR an explanation e.g. different number of red balls in each box A2
Note: Both conclusion and reasoning are required. Do not split the A2.
[2 marks]
Examiners report
The diagram shows a circular horizontal board divided into six equal sectors. The sectors are labelled white (W), yellow (Y) and blue (B).

A pointer is pinned to the centre of the board. The pointer is to be spun and when it stops the colour of the sector on which the pointer stops is recorded. The pointer is equally likely to stop on any of the six sectors.
Eva will spin the pointer twice. The following tree diagram shows all the possible outcomes.

Find the probability that both spins are yellow.
Find the probability that at least one of the spins is yellow.
Write down the probability that the second spin is yellow, given that the first spin is blue.
Markscheme
* This question is from an exam for a previous syllabus, and may contain minor differences in marking or structure.
OR (M1)
Note: Award (M1) for multiplying correct probabilities.
(0.111, 0.111111…, 11.1%) (A1) (C2)
[2 marks]
(M1)(M1)
Note: Award (M1) for and or equivalent, and (M1) for and adding only the three correct probabilities.
OR
(M1)(M1)
Note: Award (M1) for seen and (M1) for subtracting from 1. This may be shown in a tree diagram with “yellow” and “not yellow” branches.
(0.556, 0.555555…, 55.6%) (A1)(ft) (C3)
Note: Follow through marks may be awarded if their answer to part (a) is used in a correct calculation.
[3 marks]
(0.333, 0.333333…, 33.3%) (A1) (C1)
[1 mark]
Examiners report
Sara regularly flies from Geneva to London. She takes either a direct flight or a non-directflight that goes via Amsterdam.
If she takes a direct flight, the probability that her baggage does not arrive in London is 0.01.
If she takes a non-direct flight the probability that her baggage arrives in London is 0.95.
The probability that she takes a non-direct flight is 0.2.

Complete the tree diagram.
Find the probability that Sara’s baggage arrives in London.
Markscheme
* This question is from an exam for a previous syllabus, and may contain minor differences in marking or structure.
 (A1)(A1)(A1) (C3)
Note: Award (A1) for each correct pair of probabilities.
[3 marks]
(A1)(ft)(M1)
Note: Award (A1)(ft) for two correct products of probabilities taken from their diagram, (M1) for the addition of their products.
(A1)(ft) (C3)
Note: Follow through from part (a).
[3 marks]
Examiners report
A florist sells bouquets of roses. The florist recorded, in Table 1, the number of roses in each bouquet sold to customers.
Table 1

The roses can be arranged into bouquets of size small, medium or large. The data from Table 1 has been organized into a cumulative frequency table, Table 2.
Table 2

Complete the cumulative frequency table.
Write down the probability that a bouquet of roses sold is not small.
A customer buys a large bouquet.
Find the probability that there are 12 roses in this bouquet.
Markscheme
* This question is from an exam for a previous syllabus, and may contain minor differences in marking or structure.
 (A1)(A1)(ft) (C2)
Note: Award (A1) for 10; (A1)(ft) for the last column all correct. Follow through from their 10 for their 50 in the last column.
[2 marks]
(A1)(ft)(A1)(ft) (C2)
Note: Award (A1)(ft) for their numerator being 25 + their 10, and (A1)(ft) for their denominator being their 50. Follow through from part (a).
[2 marks]
(A1)(A1)(ft) (C2)
Note: Award (A1) for a numerator of 4 and (A1)(ft) for their 10 as denominator. Follow through from part (a).
[2 marks]
Examiners report
A sample of 120 oranges was tested for Vitamin C content. The cumulative frequency curve below represents the Vitamin C content, in milligrams, of these oranges.

The minimum level of Vitamin C content of an orange in the sample was 30.1 milligrams. The maximum level of Vitamin C content of an orange in the sample was 35.0 milligrams.
Giving your answer to one decimal place, write down the value of
(i) the median level of Vitamin C content of the oranges in the sample;
(ii) the lower quartile;
(iii) the upper quartile.
Draw a box-and-whisker diagram on the grid below to represent the Vitamin C content, in milligrams, for this sample.

Markscheme
* This question is from an exam for a previous syllabus, and may contain minor differences in marking or structure.
(i) 32.5 (A1)
(ii) 31.9 (A1)
(iii) 33.1 (A1) (C3)
Note: Answers must be given correct to 1 decimal place.
[3 marks]

Note: Award (A1)(ft) for correct median, (A1)(ft) for correct quartiles and box, (A1) for correct end points of whiskers and straight whiskers.
Award at most (A1)(A1)(A0) if a horizontal line goes right through the box or if the whiskers are not well aligned with the midpoint of the box.
Follow through from part (a).
[3 marks]
Examiners report
The following Venn diagram shows the sets , , and .
is an element of .

In the table indicate whether the given statements are True or False.
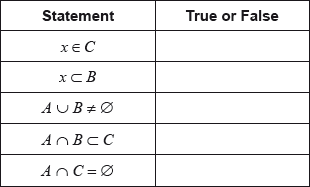
On the Venn diagram, shade the region .
Markscheme
* This question is from an exam for a previous syllabus, and may contain minor differences in marking or structure.
 (A1)(A1)(A1)(A1)(A1) (C5)
[5 marks]
 (A1) (C1)
[1 mark]
Examiners report
A tetrahedral (four-sided) die has written on it the numbers 1, 2, 3 and 4. The die is rolled many times and the scores are noted. The table below shows the resulting frequency distribution.

The die was rolled a total of 100 times.
The mean score is 2.71.
Write down an equation, in terms of and , for the total number of times the die was rolled.
Using the mean score, write down a second equation in terms of and .
Find the value of and of .
Markscheme
* This question is from an exam for a previous syllabus, and may contain minor differences in marking or structure.
or equivalent (A1) (C1)
[1 mark]
or equivalent (M1)(A1) (C2)
Note: Award (M1) for a sum including and , divided by 100 and equated to 2.71, (A1) for a correct equation.
[2 marks]
and (M1)
Note: Award (M1) for obtaining a correct linear equation in one variable from their (a) and their (b).
This may be implied if seen in part (a) or part (b).
(A1)(ft)(A1)(ft) (C3)
Notes: Follow through from parts (a) and (b), irrespective of working seen provided the answers are positive integers.
[3 marks]
Examiners report
Each month the number of days of rain in Cardiff is recorded.
The following data was collected over a period of 10 months.
11 13 8 11 8 7 8 14 x 15
For these data the median number of days of rain per month is 10.
Find the value of x.
Find the standard deviation
Find the interquartile range.
Markscheme
* This question is from an exam for a previous syllabus, and may contain minor differences in marking or structure.
(M1)
Note: Award (M1) for correct substitution into median formula or for arranging all 9 values into ascending/descending order.
(A1) (C2)
[2 marks]
2.69 (2.69072…) (A2)(ft)
Note: Follow through from part (a).
[2 marks]
13 − 8 (M1)
Note: Award (M1) for 13 and 8 seen.
= 5 (A1)(ft) (C4)
Note: Follow through from part (a).
[2 marks]
Examiners report
A city hired 160 employees to work at a festival. The following cumulative frequency curve shows the number of hours employees worked during the festival.

The city paid each of the employees £8 per hour for the first 40 hours worked, and £10 per hour for each hour they worked after the first 40 hours.
Find the median number of hours worked by the employees.
Write down the number of employees who worked 50 hours or less.
Find the amount of money an employee earned for working 40 hours;
Find the amount of money an employee earned for working 43 hours.
Find the number of employees who earned £200 or less.
Only 10 employees earned more than £. Find the value of .
Markscheme
evidence of median position (M1)
eg80th employee
40 hours A1 N2
[2 marks]
130 employees A1 N1
[1 mark]
£320 A1 N1
[1 mark]
splitting into 40 and 3 (M1)
eg3 hours more,
correct working (A1)
eg
£350 A1 N3
[3 marks]
valid approach (M1)
eg200 is less than 320 so 8 pounds/hour, ,
18 employees A2 N3
[3 marks]
valid approach (M1)
eg
60 hours worked (A1)
correct working (A1)
eg
A1 N3
[4 marks]
Examiners report
Andre will play in the semi-final of a tennis tournament.
If Andre wins the semi-final he will progress to the final. If Andre loses the semi-final, he will not progress to the final.
If Andre wins the final, he will be the champion.
The probability that Andre will win the semi-final is . If Andre wins the semi-final, then the probability he will be the champion is .
The probability that Andre will not be the champion is .
Complete the values in the tree diagram.

Find the value of .
Given that Andre did not become the champion, find the probability that he lost in the semi-final.
Markscheme
* This question is from an exam for a previous syllabus, and may contain minor differences in marking or structure. It appeared in a paper that permitted the use of a calculator, and so might not be suitable for all forms of practice.
 (A1) (C1)
Note: Award (A1) for the correct pair of probabilities.
[1 mark]
(M1)
Note: Award (M1) for multiplying and adding correct probabilities for losing equated to .
OR
(M1)
Note: Award (M1) for multiplying correct probabilities for winning equated to or .
(A1)(ft) (C2)
Note: Follow through from their part (a). Award the final (A1)(ft) only if their is within the range .
[2 marks]
(A1)(ft)(A1)
Note: Award (A1)(ft) for their correct numerator. Follow through from part (b). Award (A1) for the correct denominator.
OR
(A1)(ft)(A1)(ft)
Note: Award (A1)(ft) for their correct numerator. Follow through from part (b). Award (A1)(ft) for their correct calculation of Andre losing the semi-final or winning the semi-final and then losing in the final. Follow through from their parts (a) and (b).
(A1)(ft) (C3)
Note: Follow through from parts (a) and (b).
[3 marks]
Examiners report
Let and be normally distributed with and , .
Find so that .
It is given that .
Find .
Markscheme
METHOD 1
recognizing that is midway between the means of and . (M1)
eg  ,
,
A1 N2
METHOD 2
valid attempt to compare distributions (M1)
eg
A1 N2
[2 marks]
valid attempt to compare distributions (seen anywhere) (M1)
eg is a horizontal translation of of units to the right,
valid approach using symmetry (M1)
eg
correct working (A1)
eg
A1 N3
[4 marks]
Examiners report
Consider the following sets:
The universal set consists of all positive integers less than 15;
is the set of all numbers which are multiples of 3;
is the set of all even numbers.
Write down the elements that belong to .
Write down the elements that belong to .
Write down .
Markscheme
* This question is from an exam for a previous syllabus, and may contain minor differences in marking or structure.
= {3, 6, 9, 12} AND = {2, 4, 6, 8, 10, 12, 14} (M1)
Note: Award (M1) for listing all elements of sets and . May be seen in part (b). Condone the inclusion of 15 in set when awarding the (M1).
6, 12 (A1)(A1) (C3)
Note: Award (A1) for each correct element. Award (A1)(A0) if one additional value seen. Award (A0)(A0) if two or more additional values are seen.
[3 marks]
3, 9 (A1)(ft)(A1)(ft) (C2)
Note: Follow through from part (a) but only if their and are explicitly listed.
Award (A1)(ft) for each correct element. Award (A1)(A0) if one additional value seen. Award (A0)(A0) if two or more additional values are seen.
[2 marks]
2 (A1)(ft) (C1)
Note: Follow through from part (b)(i).
[1 mark]
Examiners report
A bag contains 5 green balls and 3 white balls. Two balls are selected at random without replacement.
Complete the following tree diagram.

Find the probability that exactly one of the selected balls is green.
Markscheme
* This question is from an exam for a previous syllabus, and may contain minor differences in marking or structure.
correct probabilities
 A1A1A1 N3
Note: Award A1 for each correct bold answer.
[3 marks]
multiplying along branches (M1)
eg
adding probabilities of correct mutually exclusive paths (A1)
eg
A1 N2
[3 marks]
Examiners report
Place the numbers and in the correct position on the Venn diagram.

In the table indicate which two of the given statements are true by placing a tick (✔) in the right hand column.

Markscheme
* This question is from an exam for a previous syllabus, and may contain minor differences in marking or structure.
 (A1)(A1)(A1)(A1) (C4)
Note: Award (A1) for each number in the correct position.
[4 marks]
 (A1)(A1) (C2)
Note: Award (A1) for each correctly placed tick.
[2 marks]
Examiners report
A group of 60 sports enthusiasts visited the PyeongChang 2018 Winter Olympic games to watch a variety of sporting events.
The most popular sports were snowboarding (S), figure skating (F) and ice hockey (H).
For this group of 60 people:
4 did not watch any of the most popular sports,
x watched all three of the most popular sports,
9 watched snowboarding only,
11 watched figure skating only,
15 watched ice hockey only,
7 watched snowboarding and figure skating,
13 watched figure skating and ice hockey,
11 watched snowboarding and ice hockey.
Find the value of x.
Markscheme
(M1)
Note: Award (M1) for equating the sum of at least seven of the entries in their Venn diagram to 60.
(A1)(ft) (C2)
Note: Follow through from part (a), but only if answer is positive.
[2 marks]
Examiners report
Let A and B be events such that , and .
Find .
Markscheme
attempt to substitute into (M1)
Note: Accept use of Venn diagram or other valid method.
(A1)
(seen anywhere) A1
attempt to substitute into (M1)
A1
[5 marks]